What it shows you
The whole estate, ranked.
Grouped below by the question each one answers, not by the order of the tabs. Everything in this section is in Community, the free edition, on as many hosts as you own, except where a row says otherwise.
What needs you now
The first screen, and on most mornings the only one you need.
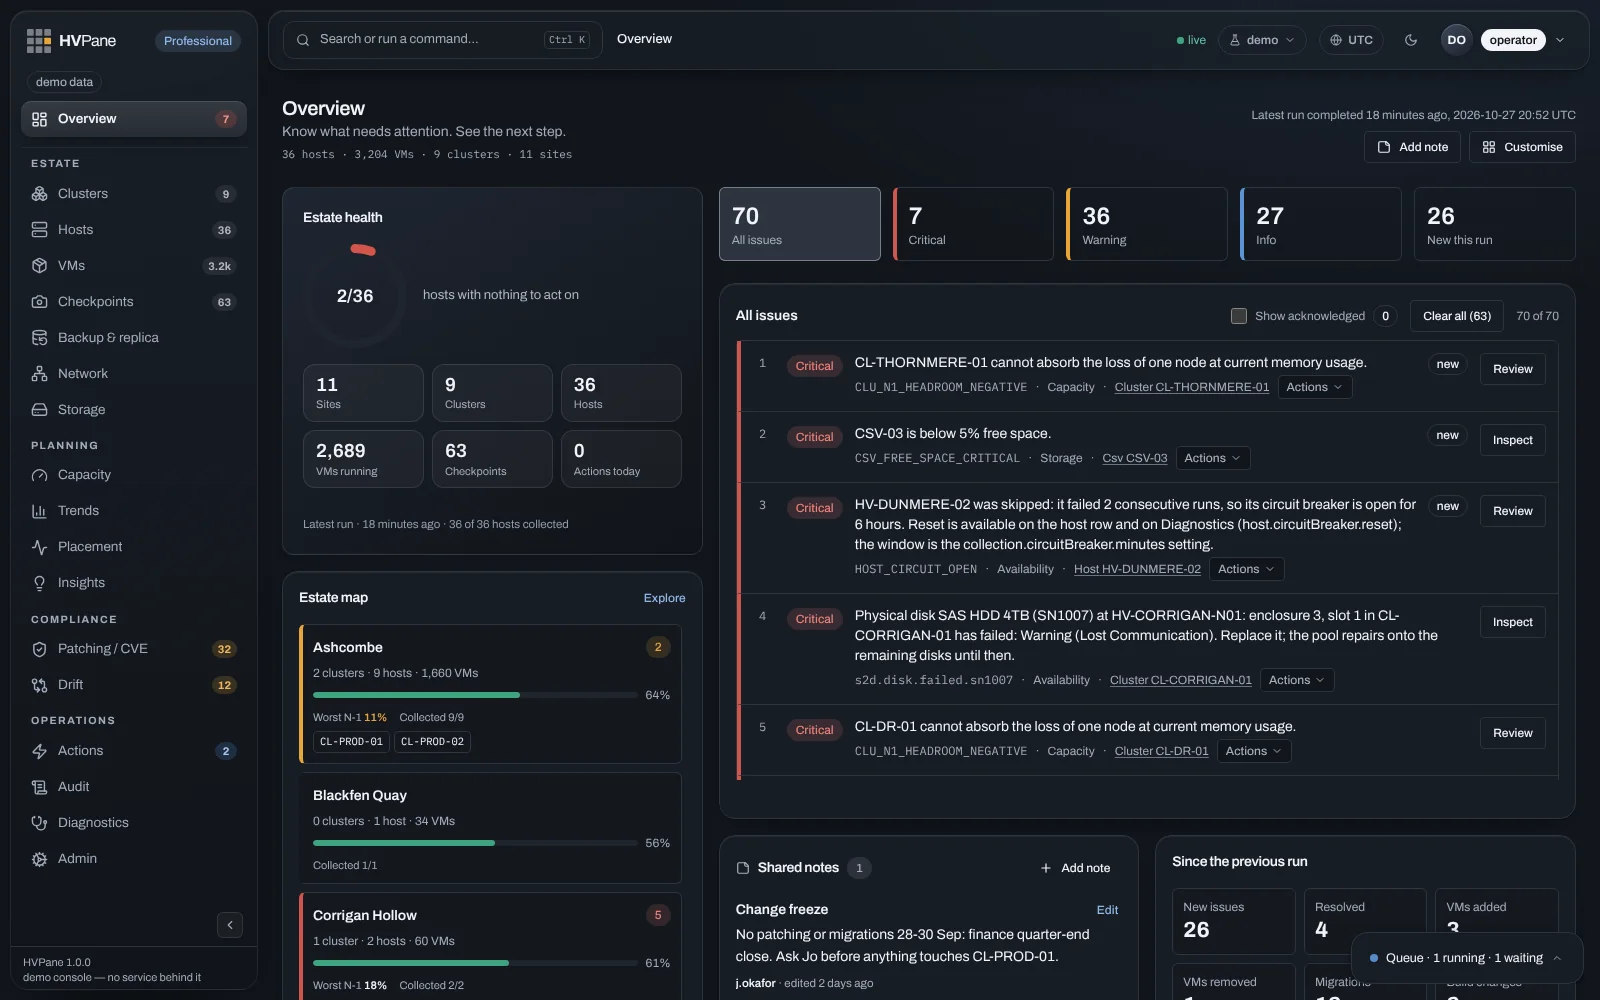
Issues across every host and cluster, ordered by how much they matter, each with a next step rather than a red number. Cluster health beside it.
New issues, resolved issues, machines added and removed, live migrations, hosts rebuilt. The tab nobody else has, and usually the one that explains the others.
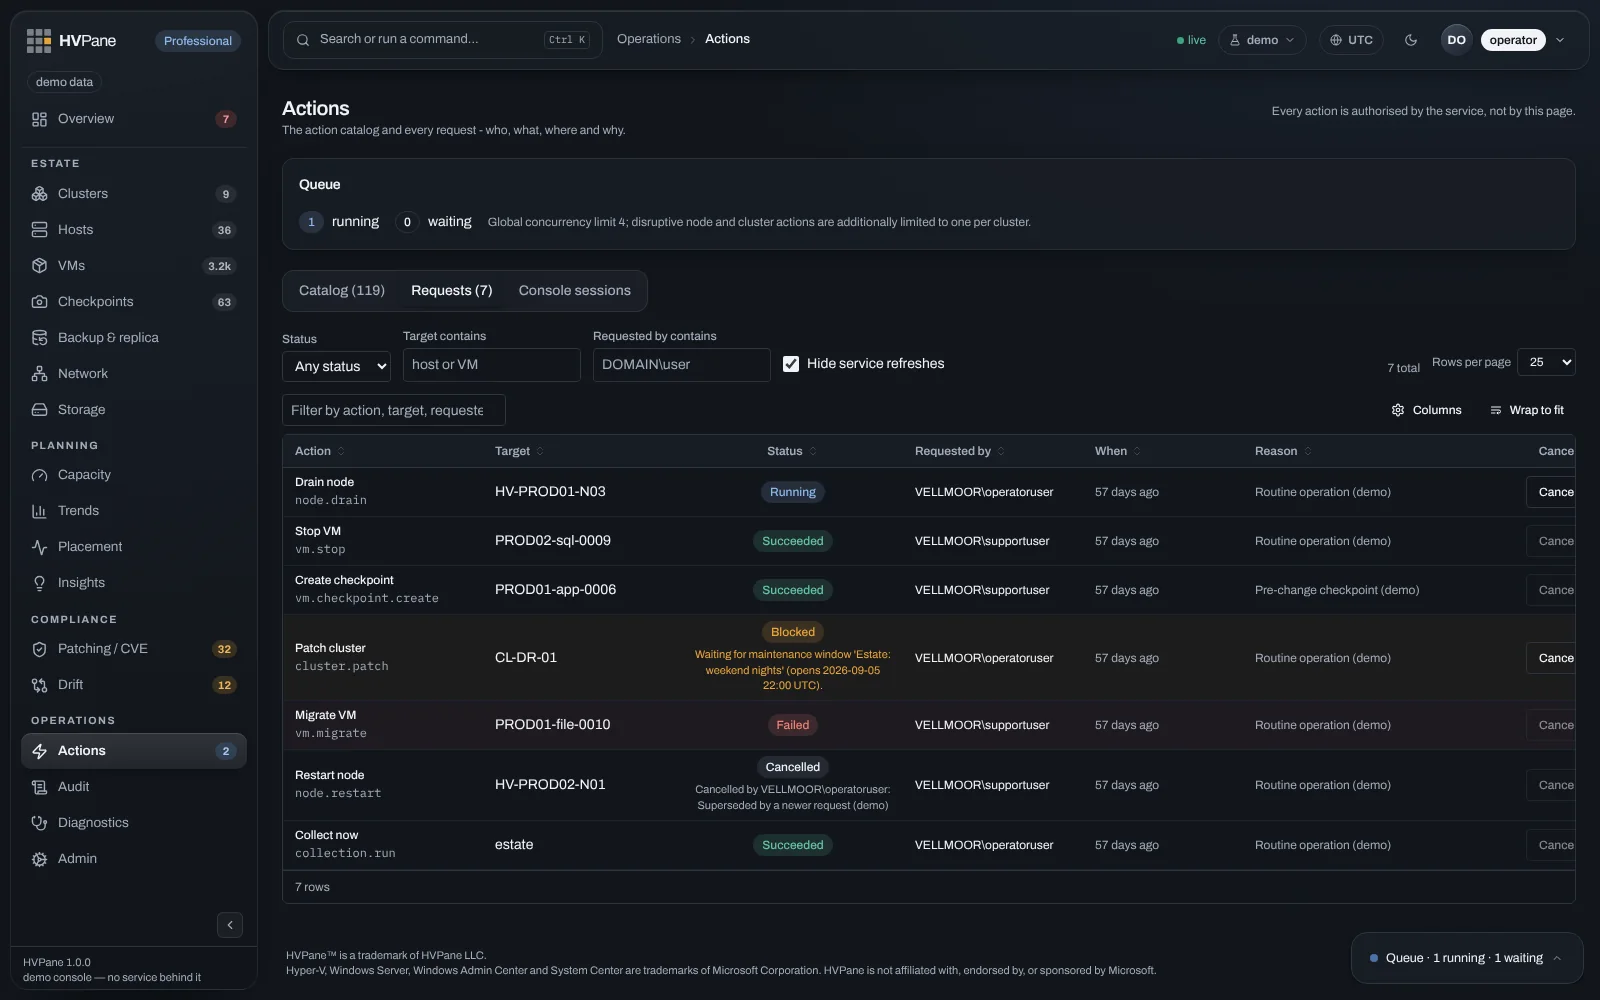
What the product could not read, and why. A host it failed to reach is stated, not quietly omitted from the totals.
Will it hold
Capacity as a question about survival, not a percentage.
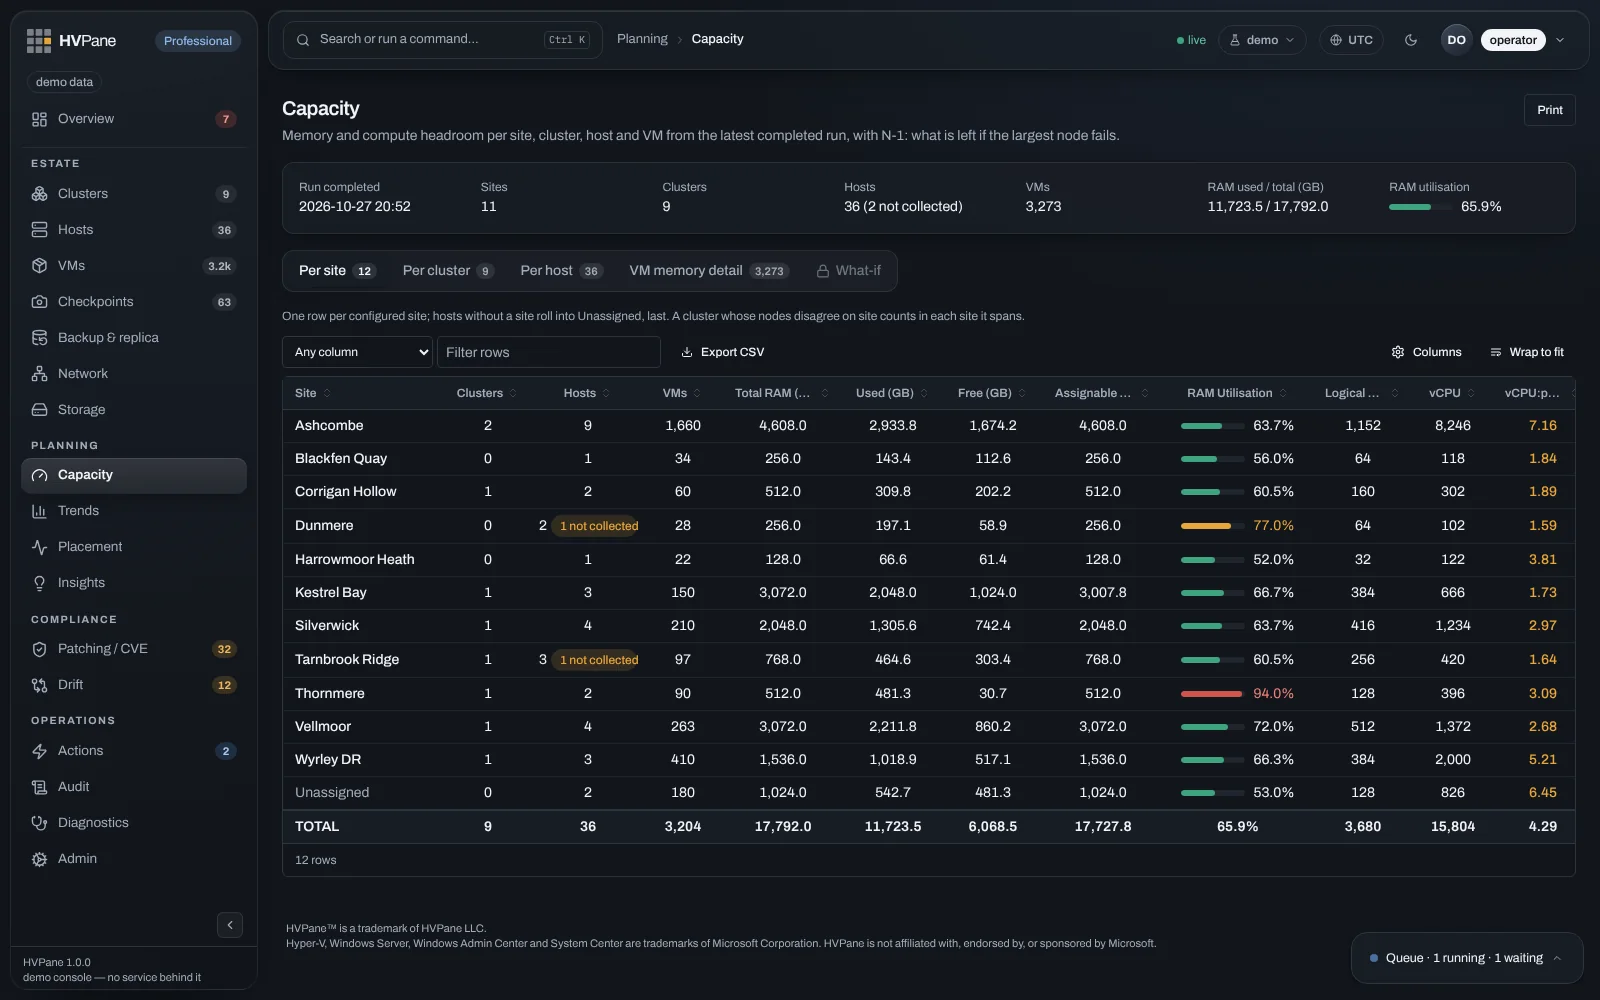
Not what is used — what still fits when you lose a node. The arithmetic you would otherwise redo by hand, for every cluster, every morning.
Days until a cluster crosses 90% memory. Days until a volume fills. Drawn from your own accumulated history, on the page, with no data warehouse to stand up.
Anti‑affinity that quietly stopped being true, preferred owners, clusters out of balance.
The things that rot quietly
Nothing alerts on these. They are found by looking, and nobody has time to look.
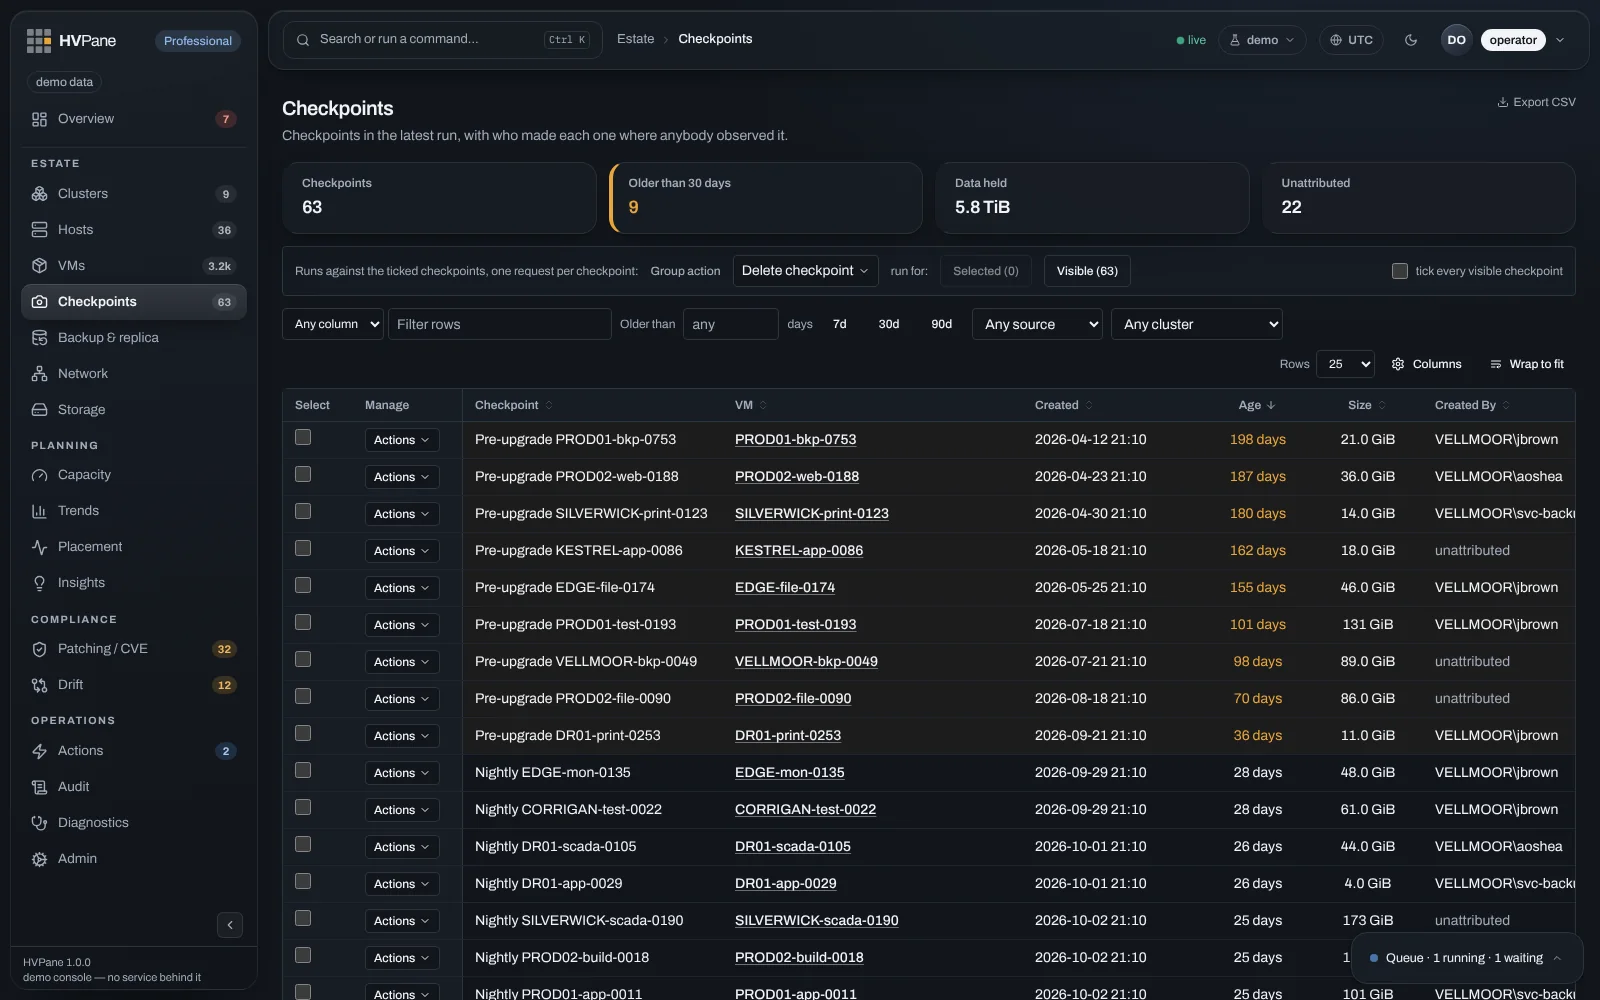
Age, and how much data each is holding. Plus who created it, wherever it was taken — something Hyper‑V does not record at all.Requires Professional
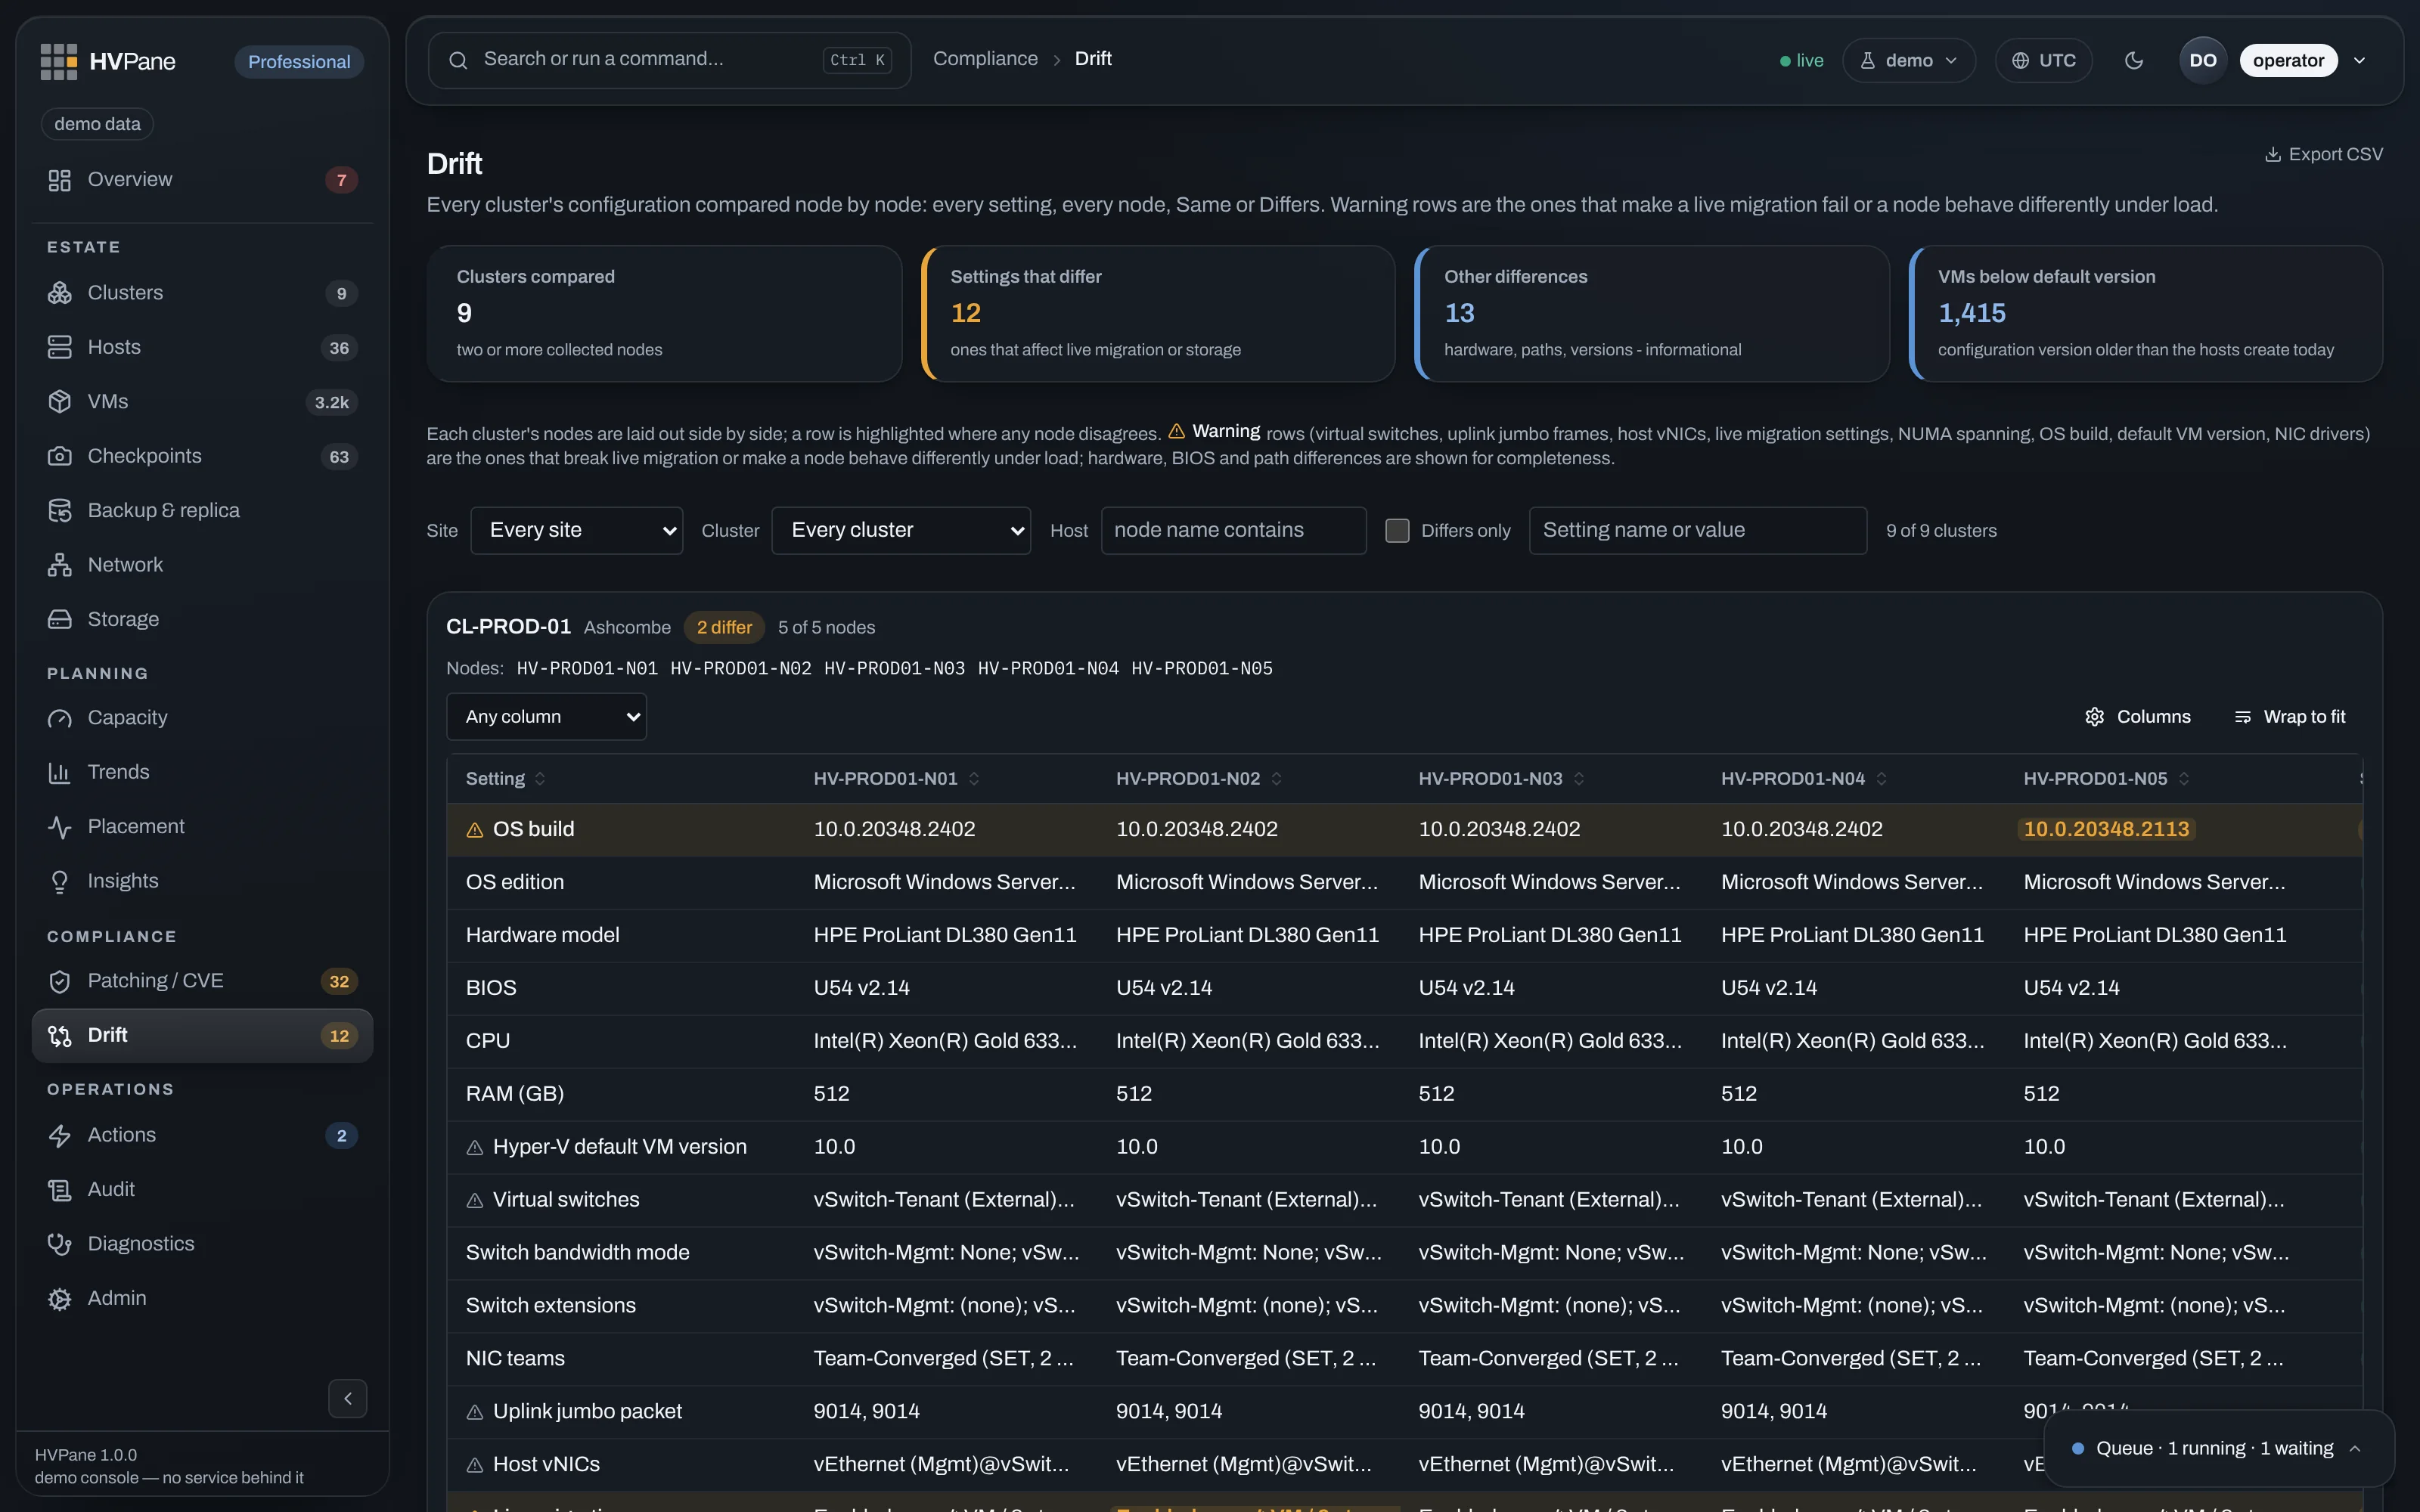
A standing node‑by‑node matrix per cluster. The one host somebody set up differently, found without running a validation report.
Volumes, ownership, and every differencing disk hanging off a machine you had forgotten about.
The inventory
Everything you run, in one list you can filter, sort and link to.
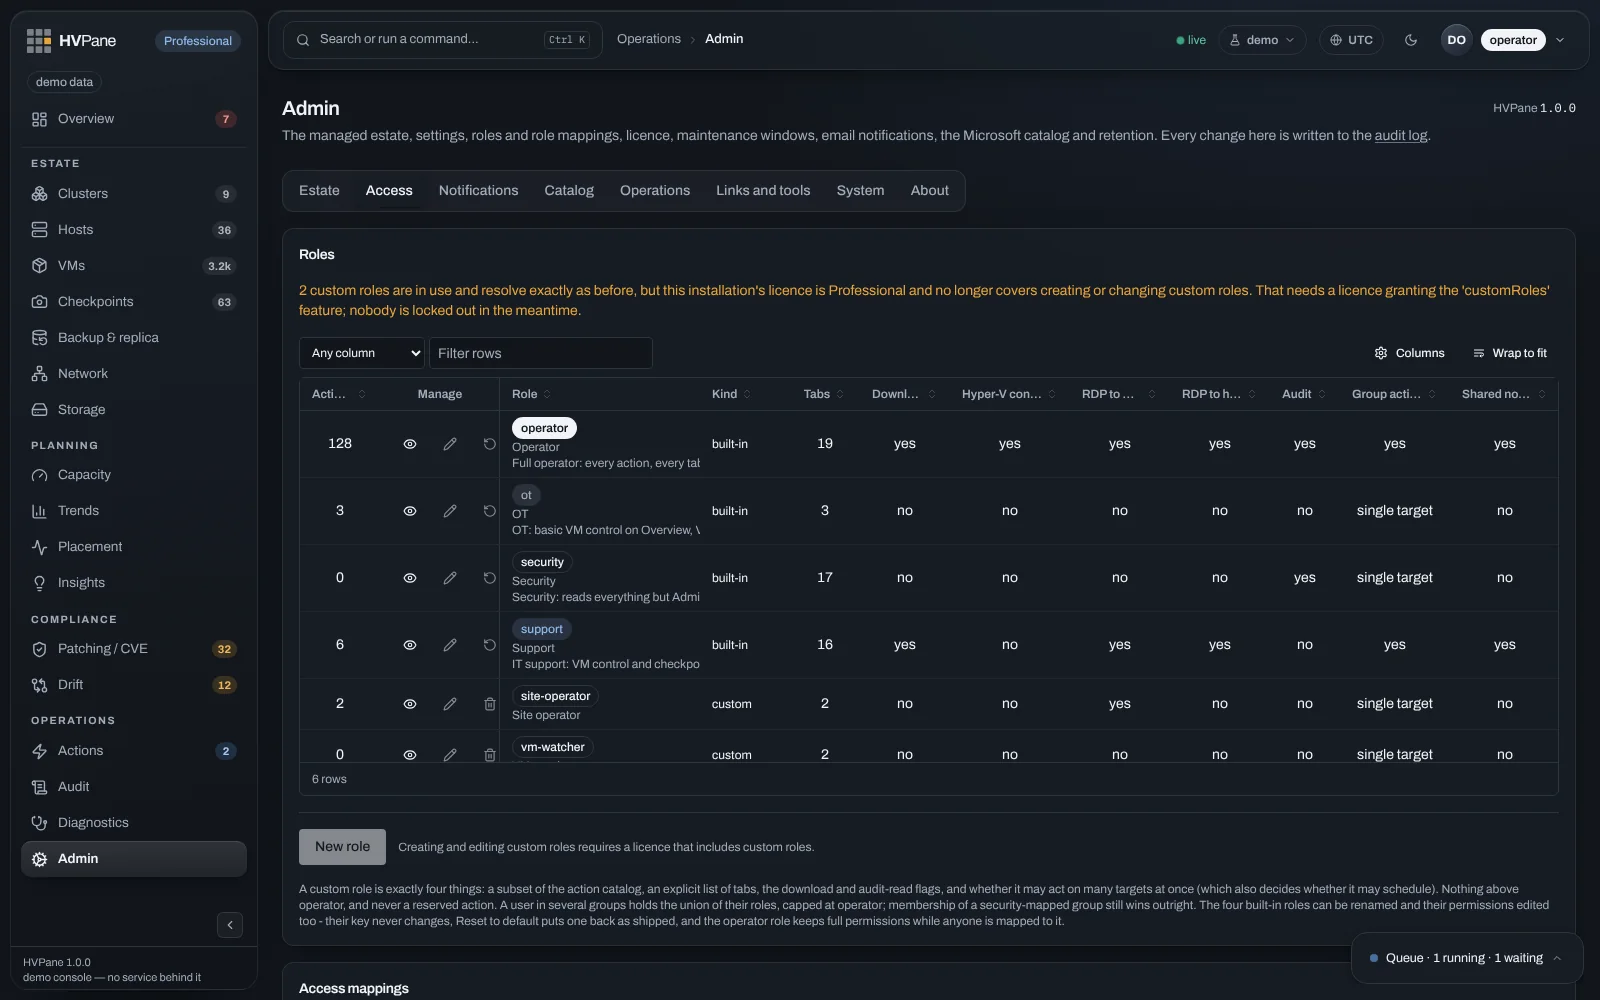
Every host and every VM across every cluster and site, with deep links so a finding can be sent to someone as a URL.
Switches, adapters and the machines attached to them.
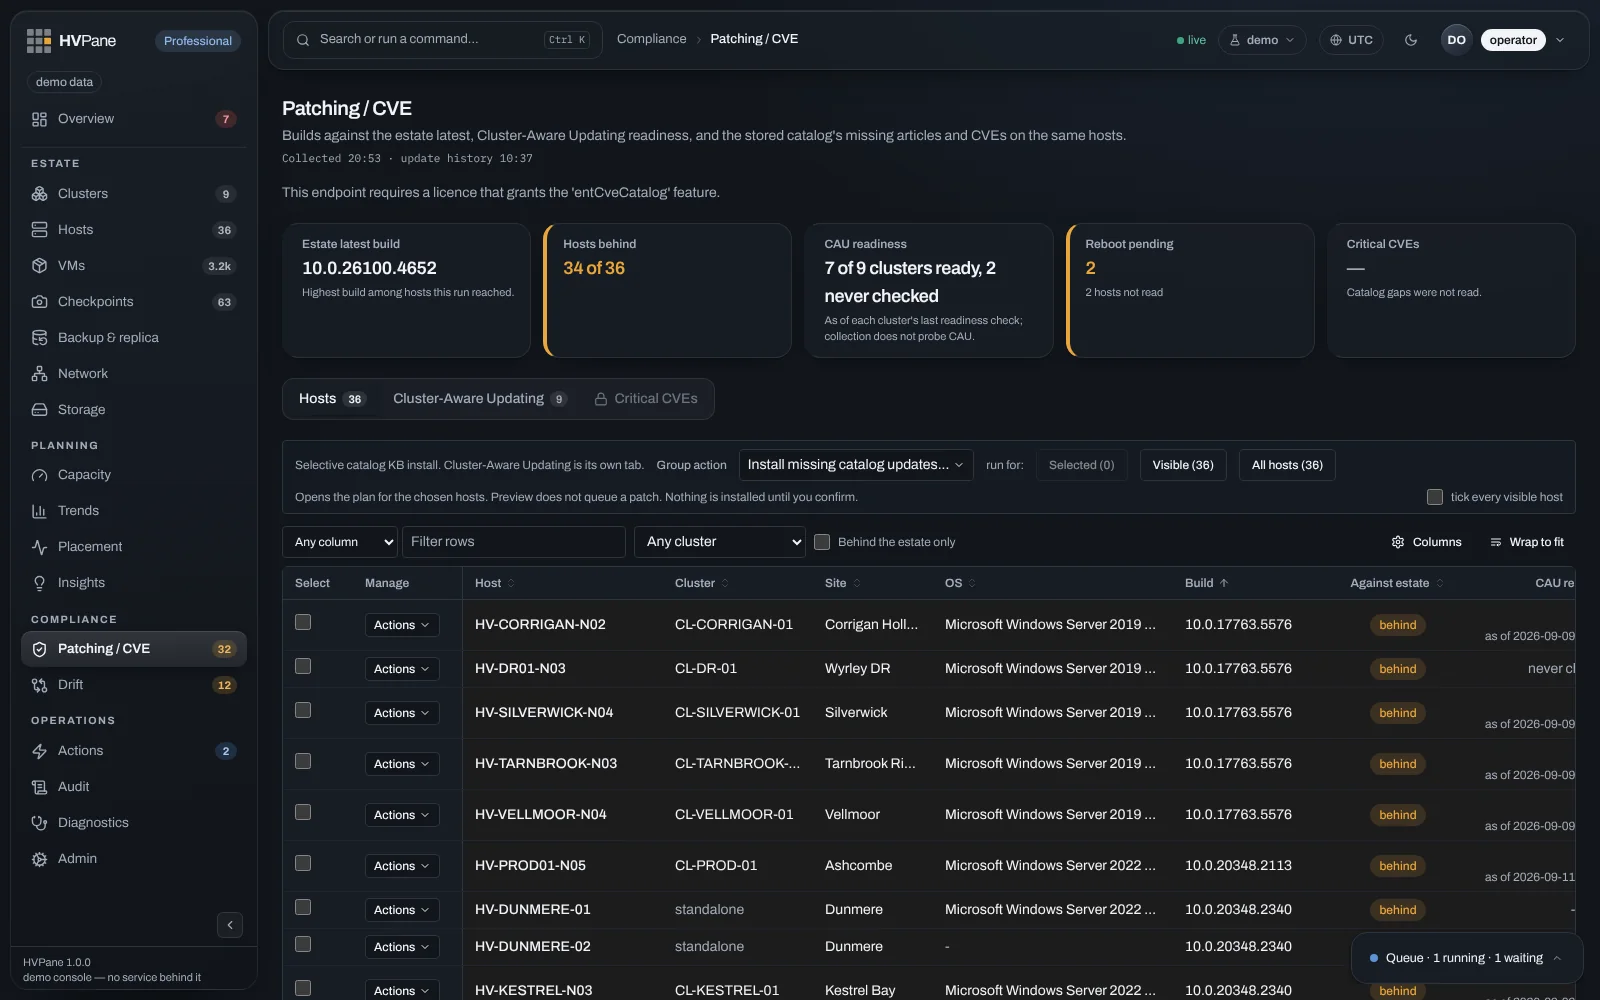
Build level against the newest in your own estate, drain‑on‑shutdown, Cluster‑Aware Updating readiness — and the update source and proxy bypass list as configured on each node.
The failure this is for. A cluster where patching silently fails on two nodes, because the update server is not in those nodes’ proxy bypass list. They report no error. They simply never reach it, and they drift further behind every month while nothing anywhere says a word. HVPane puts every node’s update source and bypass list in one column, so the two that disagree are visible in the time it takes to read a page.
One honest limit, stated here rather than discovered later. The forecasts are built from history, and a fresh install has none. For the first days it will tell you it does not have enough history yet rather than draw a line it cannot stand behind. Everything else works from the first collection.